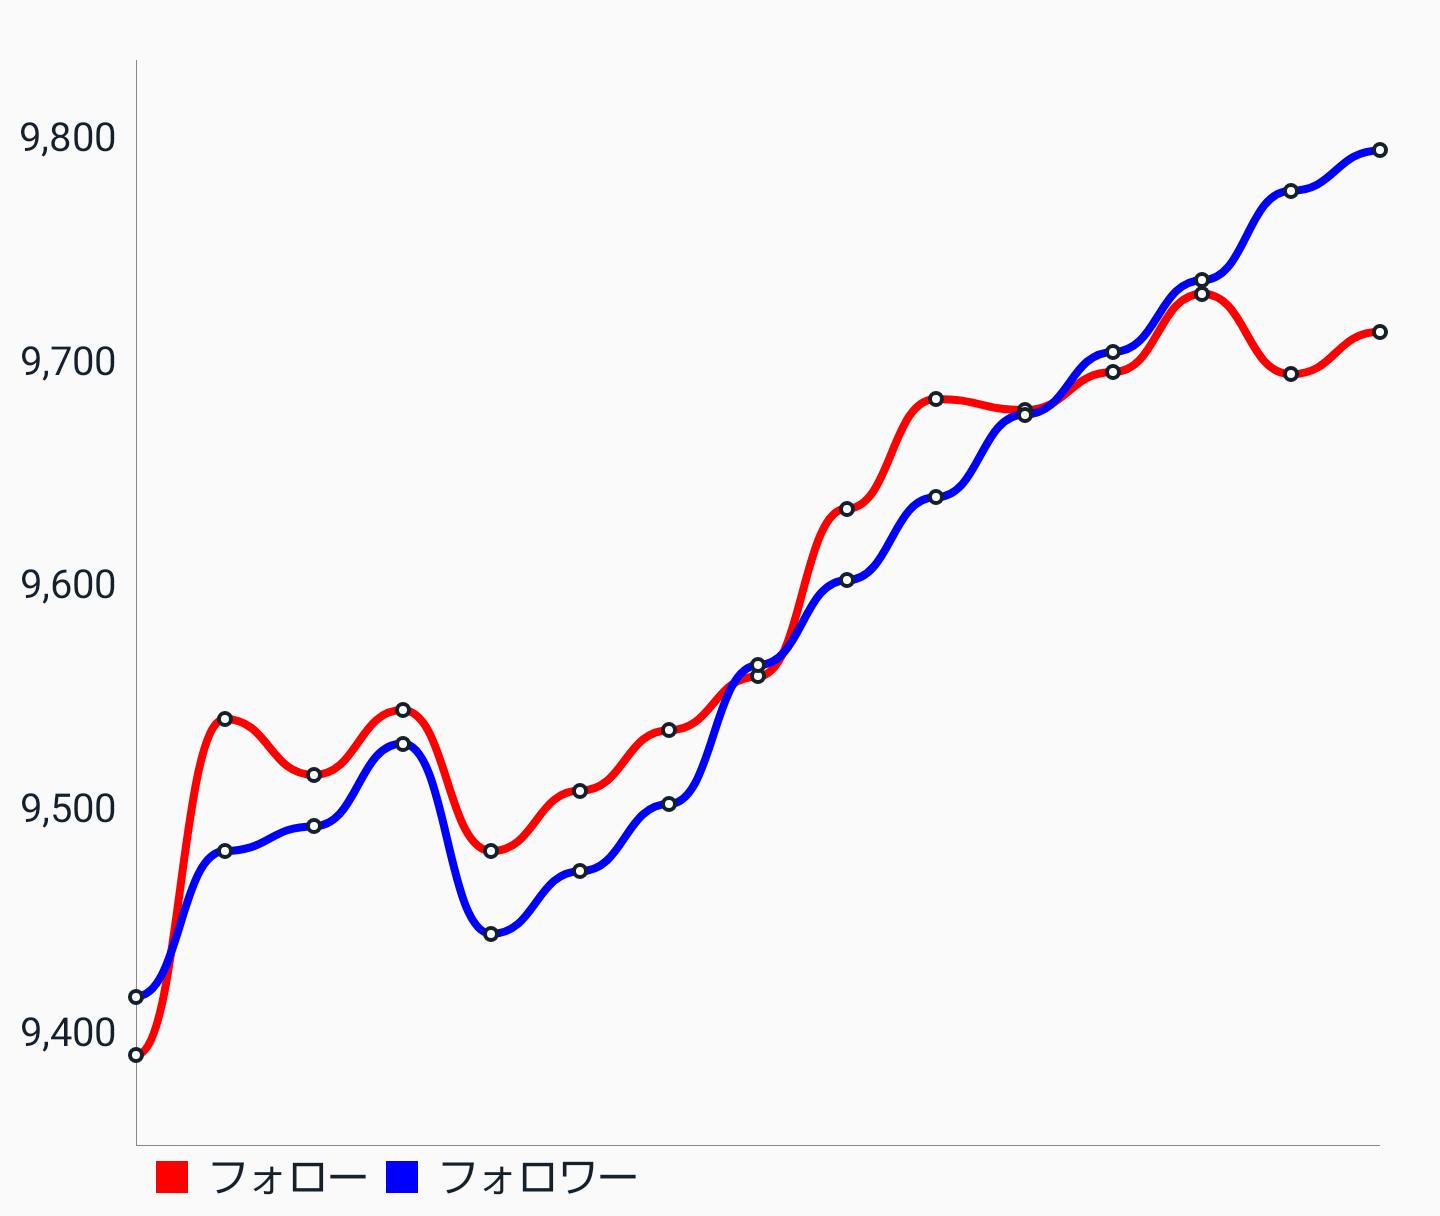
ゴールは↑の画像です。
グラフの素敵ライブラリーMPAndroidChartを使って折れ線グラフを実装します。
このグラフは個人アプリに組み込んでるものなので個人アプリ見てみてね!
このアプリで実装してるのを少し編集して載せてるから実装を参考にする人は脳内変換をしてください。

見つかりませんでした
play.google.com
実装
依存
// グラフライブラリ
implementation 'com.github.PhilJay:MPAndroidChart:v3.1.0'
レイアウト
    <!-- グラフ -->
    <com.github.mikephil.charting.charts.LineChart
        android:id="@+id/lineChart"
        android:layout_width="match_parent"
        android:layout_height="0dp"
        android:layout_weight="1" />
グラフを初期化
// グラフ設定
private fun setupGraph() {

    lineChart.apply {
        // グラフ説明テキスト
        description = null

        setBackgroundColor(getAttrColor(R.attr.BackgroundColor))

        // グラフ下の項目
        legend.apply {
            textColor = getAttrColor(R.attr.MainTextColor)
        }

        // Y軸(右)は表示しない
        axisRight.apply {
            isEnabled = false
            setDrawGridLines(false)
        }

        // Y軸(左)の設定
        axisLeft.apply {
            setDrawGridLines(false)
            textColor = getAttrColor(R.attr.MainTextColor)
        }

        // X軸の設定
        xAxis.apply {
            setDrawGridLines(false)
            setDrawLabels(false)
            setAvoidFirstLastClipping(true)
            position = XAxis.XAxisPosition.BOTTOM
        }
    }
}
折れ線の設定
// 折れ線の設定
private fun getLineDataSet(list: List<Entry>, label: String, color: Int) =
    LineDataSet(list, label).apply {
        this.color = color
        mode = LineDataSet.Mode.HORIZONTAL_BEZIER
        valueTextColor = getAttrColor(R.attr.MainTextColor)
        valueTextSize = 8f
        lineWidth = 2f
        setDrawValues(false)
        isHighlightEnabled = true
        setCircleColor(getAttrColor(R.attr.MainTextColor))

    }
グラフに折れ線を追加
// グラフのデータ設定
private fun setGraphData(list: List<GraphEntity>) {
    val followList = mutableListOf<Entry>()
    val followerList = mutableListOf<Entry>()
    list.reversed().forEachIndexed { index, graphEntity ->
        followList.add(
            Entry(
                index.toFloat(),
                graphEntity.followCount.toFloat(),
                graphEntity.date
            )
        )
        followerList.add(
            Entry(
                index.toFloat(),
                graphEntity.followerCount.toFloat(),
                graphEntity.date
            )
        )
    }

    val dataSets = mutableListOf<ILineDataSet>()
    dataSets.add(
        getLineDataSet(
            followList,
            getString(R.string.history_graph_label_follow),
            Color.RED
        )
    )
    dataSets.add(
        getLineDataSet(
            followerList,
            getString(R.string.history_graph_label_follower),
            Color.BLUE
        )
    )
    val lineData = LineData(dataSets)
    lineChart.data = lineData
}